Sunday, July 12, 2009

9 Tricks Of The Successful Trader

by Selwyn Gishen

For all of its numbers, charts and ratios, trading is more art than science. And just as in artistic endeavors, there is talent involved, but talent will only take you so far. The best traders hone their skills through practice and discipline. They perform self analysis to see what drives their trades and learn how to keep fear and greed out of the equation. In this article we'll look at nine steps a novice trader can use to perfect his or her craft; for the experts out there, you might just find some tips that will help you make smarter, more profitable trades, too.

Step 1. Define your goals and then choose a style of trading that is compatible with those goals. Be sure your personality is a match for the style of trading you choose.

Before you set out on any journey, it is imperative that you have some idea of where your destination is and how you will get there. Consequently, it is imperative that you have clear goals in mind as to what you would like to achieve; you then have to be sure that your trading method is capable of achieving these goals. Each type of trading style requires a different approach and each style has a different risk profile, which requires a different attitude and approach to trade successfully. For example, if you cannot stomach going to sleep with an open position in the market then you might consider day trading. On the other hand, if you have funds that you think will benefit from the appreciation of a trade over a period of some months, then a position trader is what you want to consider becoming. But no matter what style of trading you choose, be sure that your personality fits the style of trading you undertake. A personality mismatch will lead to stress and certain losses.

Step 2. Choose a broker with whom you feel comfortable but also one who offers a trading platform that is appropriate for your style of trading.

It is important to choose a broker who offers a trading platform that will allow you to do the analysis you require. Choosing a reputable broker is of paramount importance and spending time researching the differences between brokers will be very helpful. You must know each broker's policies and how he or she goes about making a market. For example, trading in the over-the-counter market or spot market is different from trading the exchange-driven markets. In choosing a broker, it is important to read the broker documentation. Know your broker's policies. Also make sure that your broker's trading platform is suitable for the analysis you want to do. For example, if you like to trade off of Fibonacci numbers, be sure the broker's platform can draw Fibonacci lines. A good broker with a poor platform, or a good platform with a poor broker, can be a problem. Make sure you get the best of both.

Step 3. Choose a methodology and then be consistent in its application.

Before you enter any market as a trader, you need to have some idea of how you will make decisions to execute your trades. You must know what information you will need in order to make the appropriate decision about whether to enter or exit a trade. Some people choose to look at the underlying fundamentals of the company or economy, and then use a chart to determine the best time to execute the trade. Others use technical analysis; as a result they will only use charts to time a trade. Remember that fundamentals drive the trend in the long term, whereas chart patterns may offer trading opportunities in the short term. Whichever methodology you choose, remember to be consistent. And be sure your methodology is adaptive. Your system should keep up with the changing dynamics of a market.

Step 4. Choose a longer time frame for direction analysis and a shorter time frame to time entry or exit.

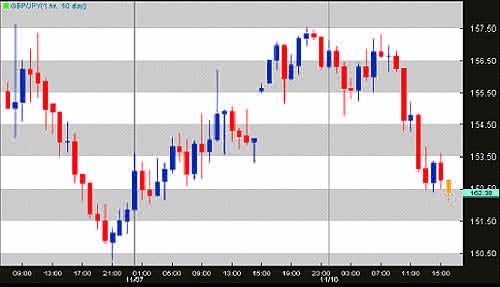
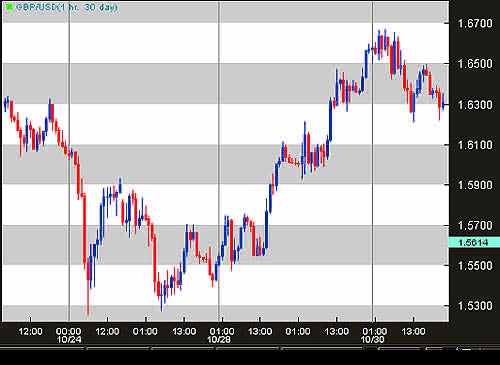
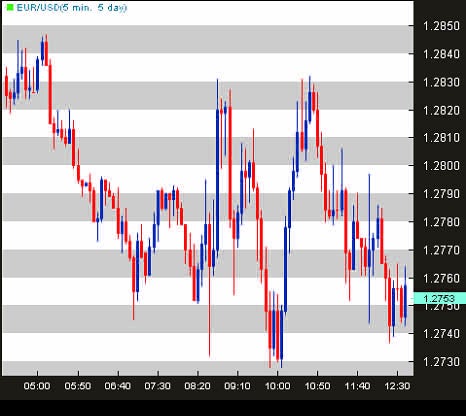
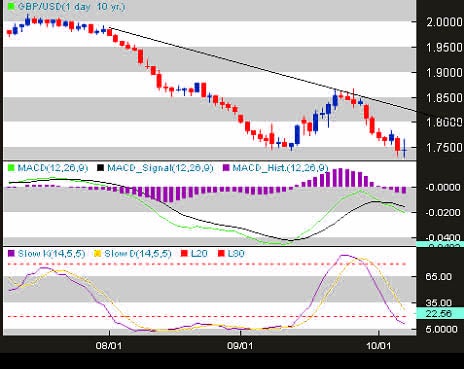
Many traders get confused because of conflicting information that occurs when looking at charts in different time frames. What shows up as a buying opportunity on a weekly chart could, in fact, show up as a sell signal on an intraday chart. Therefore, if you are taking your basic trading direction from a weekly chart and using a daily chart to time entry, be sure to synchronize the two. In other words, if the weekly chart is giving you a buy signal, wait until the daily chart also confirms a buy signal. Keep your timing in sync.

Step 5. Calculate your expectancy.

Expectancy is the formula you use to determine how reliable your system is. You should go back in time and measure all your trades that were winners, versus all your trades that were losers. Then determine how profitable your winning trades were versus how much your losing trades lost.

Take a look at your last 10 trades. If you haven't made actual trades yet, go back on your chart to where your system would have indicated that you should enter and exit a trade. Determine if you would have made a profit or a loss. Write these results down. Total all your winning trades and divide the answer by the number of winning trades you made. Here is the formula:


E= [1+ (W/L)] x P – 1

where:

W =
Average Winning Trade
L = Average Losing Trade
P = Percentage Win Ratio

Example:
If you made 10 trades and six of them were winning trades and four were losing trades, your percentage win ratio would be 6/10 or 60%. If your six trades made $2,400, then your average win would be $2,400/6 = $400. If your losses were $1,200, then your average loss would be $1,200/4 = $300. Apply these results to the formula and you get; E= [1+ (400/300)] x 0.6 - 1 = 0.40 or 40%. A positive 40% expectancy means that your system will return you 40 cents per dollar over the long term.

Step 6. Focus on your trades and learn to love small losses.

Once you have funded your account, the most important thing to remember is that your money is at risk. Therefore, your money should not be needed for living or to pay bills etc. Consider your trading money as if it were vacation money. Once the vacation is over your money is spent. Have the same attitude toward trading. This will psychologically prepare you to accept small losses, which is key to managing your risk. By focusing on your trades and accepting small losses rather than constantly counting your equity, you will be much more successful.

Secondly, only leverage your trades to a maximum risk of 2% of your total funds. In other words, if you have $10,000 in your trading account, never let any trade lose more than 2% of the account value, or $200. If your stops are farther away than 2% of your account, trade shorter time frames or decrease the leverage.

Step 7. Build positive feedback loops.

A positive feedback loop is created as a result of a well-executed trade in accordance with your plan. When you plan a trade and then execute it well, you form a positive feedback pattern. Success breeds success, which in turn breeds confidence - especially if the trade is profitable. Even if you take a small loss but do so in accordance with a planned trade, then you will be building a positive feedback loop.

Step 8. Perform weekend analysis.

It is always good to prepare in advance. On the weekend, when the markets are closed, study weekly charts to look for patterns or news that could affect your trade. Perhaps a pattern is making a double top and the pundits and the news is suggesting a market reversal. This is a kind of reflexivity where the pattern could be prompting the pundits while the pundits are reinforcing the pattern. Or the pundits may be telling you that the market is about to explode. Perhaps these are pundits hoping to lure you into the market so that they can sell their positions on increased liquidity. These are the kinds of actions to look for to help you formulate your upcoming trading week. In the cool light of objectivity, you will make your best plans. Wait for your setups and learn to be patient.

If the market does not reach your point of entry, learn to sit on your hands. You might have to wait for the opportunity longer than you anticipated. If you miss a trade, remember that there will always be another. If you have patience and discipline you can become a good trader.

Step 9. Keep a printed record.

Keeping a printed record is one of the best learning tools a trader can have. Print out a chart and list all the reasons for the trade, including the fundamentals that sway your decisions. Mark the chart with your entry and your exit points. Make any relevant comments on the chart. File this record so you can refer to it over and over again. Note the emotional reasons for taking action. Did you panic? Were you too greedy? Were you full of anxiety? Note all these feelings on your record. It is only when you can objectify your trades that you will develop the mental control and discipline to execute according to your system instead of your habits.

Bottom Line

The steps above will lead you to a structured approach to trading and in return should help you become a more refined trader. Trading is an art and the only way to become increasingly proficient is through consistent and disciplined practice. Remember the expression: the harder you practice the luckier you'll get.

The Pure Fade Trade

by Kathy Lien

Everyone wants to be the hero and claim that he or she picked the very top or bottom of a currency pair. However, aside from bragging rights, is there really anything that pleasant about repeatedly selling at every new high in the hope that this one will finally be the top?

One of the biggest pitfalls encountered by novice traders is arbitrarily picking a top or bottom with no indicator support. The pure fade trade is an intraday strategy that picks a top or bottom based on a clear recovery following an extreme move. Here we'll cover this strategy and show you how you can put it to use.

Overview

The strategy looks for an intraday reversal by using a combination of three sets of Bollinger bands and the relative strength index (RSI) on hourly charts. The trade sets up when the RSI hits either an overbought or oversold level. Overbought is defined as an RSI above 70, while oversold is defined as an RSI below 30. This signals that we can start looking for a possible reversal.

However, rather than just immediately buying in the top of a trend reversal based solely upon RSI, we add in three sets of Bollinger bands to help us identify the point of exhaustion. The reason we use three sets of Bollinger bands is because it helps us to gauge the extremity of the move along with the extent of the possible recovery.

Created in the 1980s by John Bollinger, the Bollinger bands strategy was originally based on two standard deviations (SD) above and below the 20-day moving average. The theory was then to buy or sell when the prices hit the Bollinger band because using two standard deviations ensures that 95% of the price action will fall between the two bands.

In our strategy, we add on a third standard deviation Bollinger band. When prices hit the third band on any side, we know that the move is within the 5% minority, which characterizes the move as "extreme". When we move away from the third standard deviation Bollinger band and into the zone between the first and second standard deviation Bollinger bands, we know that the currency pair has hit its extreme point at the moment and is moving into reversal phase. Finally, one last thing that we look for is for at least one candle to close fully between the second and first standard deviation bands. This last rule helps to screen out fake moves and ensures that the previous move is really an exhaustion. This is a low-risk, low-return trade for those who simply want to scalp the market for small profits. Only hourly charts are recommended for the strategy.

Rules for a Long Trade
  1. Look for the relative strength index to be lower than 30.
  2. Watch for the price to hit the three standard deviation Bollinger band (SD BB).
  3. Wait for the candle to move from the 3SD-2SD BB zone into the 2SD-1SD BB zone on hourly charts.
  4. After one candle closes fully within the 2SD-1SD BB zone, buy at market.
  5. Place a stop at swing low minus 10 pips.
  6. The first target for half of the position is the amount risked; move the stop to breakeven.
  7. The second target is the tag of the second SD BB on the topside.
Rules for a Short Trade
  1. Look for the relative strength index to be greater than 70.
  2. Watch for the price to hit the three standard deviation Bollinger band (SD BB).
  3. Wait for the candle to move from the 3SD-2SD BB zone into the 2SD-1SD BB zone on hourly charts.
  4. After one candle closes fully within the 2SD-1SD BB zone, sell at market price.
  5. Place stop at swing high plus 10 pips.
  6. The first target for half of the position is the amount risked; move the stop to breakeven.
  7. The second target is the tag of the second SD BB on the downside.
The Fade Trade in Action

Let's explore some examples:

The first example is the EUR/USD from February 22, 2006 (Figure 1). The currency pair started breaking down shortly after the London open and hit our radar screen when we saw RSI dip below 30, around 6am EST. We checked the Bollinger bands and saw that the price also hit our third standard deviation band at that time and was trading between the third and second standard deviation Bollinger bands.

We watched closely for a full close within the second and first standard deviation Bollinger bands, at which time we bought at market. Our trade was triggered at 9am EST, and we entered into a long position at 1.1884. We immediately placed our stop at the swing low of 1.1862, risking 22 pips on the trade.

Figure 1: Pure Fade, EUR/US
Source: FXtrek Intellichart


Because our first take-profit is the amount that we risked, we put in an order to sell half of the position at 1.1906. The order gets triggered four hours later at 1pm EST. We move our stop to breakeven and get ready to sell the second half when the price hits the second standard deviation Bollinger band on the topside. The remainder of the position is eventually closed out at 1.1939 for a total trade profit of 55 pips.

Figure 2: Pure Fade, NZD/USD
Source: FXtrek Intellichart

The next example is the NZD/USD on February 26, 2006. Like the EUR/USD in the previous example, the currency pair range traded down going into the open of the Asian markets, when New Zealand economic data is typically released. Our pure fade trade set up when we saw RSI dip below 30 at 6pm EST. We checked to see that the price had also hit our third standard deviation Bollinger band at that time.

We then watched carefully for a full bar close between the second and first standard deviation Bollinger bands. This happened at 9pm EST, at which time we went long at the open of the next bar, or at 0.6583. We placed our stop at the swing low of 0.6568, risking a total of 15 pips on the trade. The risk is very small, which puts our profit at a very achievable 0.6598. This level is reached at 8am EST the next day, at which time we move our stop to breakeven and target the second deviation Bollinger band on the top side for the remainder of our position. The band is hit and we exit at 0.6605, for a total trade profit of 18.5 pips.

Short Side

On the short side, we look at an example in USD/JPY from March 10, 2006. Going into the open of the U.S. markets, we watched USD/JPY trade quietly in a tight range. Shortly after the typical 8:30am EST U.S. numbers, the currency pair hit our radar screens when RSI broke above 70, the benchmark for overbought conditions. At the same time, the price hit the third standard deviation Bollinger band and we watched for a full close between the second and first standard deviation bands. This happened three hours later and we entered a short USD/JPY position at 119.03.

Our stop is the swing high of 119.13, putting our risk at a tiny 10 pips. Our first target was 118.93, which was triggered at 3pm EST. Once our target was hit, we moved our stop on the remainder of the position to breakeven and looked to take profit once we hit the second Bollinger band on the downside.
Figure 3: Pure Fade, USD/JPY
Source: FXtrek Intellichart

At 4am EST the following day, we exited the remainder of our position at 118.80 for a total trade profit of 16.5 pips, before the position reversed course and started rallying once again. As you can see, the pure fade trade takes small profits quickly in times of trend exhaustion; however, more often than not, the trend continues course after prices hit the second Bollinger band in the opposite direction.

Figure 4: Pure Fade, GBP/US
Source: FXtrek Intellichart

The GBP/USD chart above is another good example of a short fade trade. On March 16, 2006, we watched the GBP/USD trade in a tight range going into the release of February U.S. consumer prices. The dollar began to sell off shortly after 8:30am EST, after the softer-than-expected report, and continued to push the GBP/USD higher for the next seven hours.

The currency pair hit our radar screen at noon EST when RSI broke above 70. We checked to see that the price was also tagging the third standard deviation Bollinger band on the top side, and we began to look for an opportunity to go short the GBP/USD when we saw a full bar close below the third and second standard deviation Bollinger band zone. This occurred at 4pm EST at which time we went short at the open of the following bar, or 1.7569.


We placed our stop at the swing high of 1.7594, risking 25 pips. The target for the first half of our position is the entry minus the amount that we risked, or 1.7544. After we entered into our position, the GBP/USD began to gradually sell off, triggering our take-profit order at 10pm EST. We then looked to exit the remainder of the position when the price hit the first standard deviation Bollinger band on the opposite side. This occurred the following day, giving us an exit of 1.7527 and earning us a total of 33.5 pips on the entire trade.

At this point, some traders looking at the charts may say, "Oh wow, the second half was triggered at 3am EST. I'm asleep!" It is very likely that you will not be able to spend the entire wee hours with your eyes glued to the computer screen, so for those who just want a target to place the second take-profit order, two times risk would be a good level. In this case, we could have placed our second exit order at 1.7519.

When It Failed

Of course, no one strategy can be accurate 100% of the time, so the last example is one where the trade did not end up in a profit. The GBP/JPY chart above is from February 14, 2006. At 7pm EST, or at the Asian market open, GBP/JPY began to break out of its post-U.S./pre-Asian price consolidation. RSI breached the 30 oversold mark, and the price hit the third standard deviation Bollinger band, which put the currency on our radar screen, where we looked for an opportunity to go long.
Figure 5: Pure Fade, GBP/JPY
Source: FXtrek Intellichart

We waited until four hours later and saw a candle open and close fully within the first and second standard deviation Bollinger bands, so we looked to buy at the open of the next candle. Our entry price is 204.52. We put our stop at the swing low, or 204.34, risking a total of 18 pips. Following our rules of taking profit on the first half of our position by the amount risked, we put an entry order to sell half at 204.70. GBP/JPY, however, was unable to sustain its momentary relief rally and proceeded to extend its weakness. We were stopped out at 204.34, two hours later, but because the risk was small, the loss would have had a minimal impact on most trading accounts.

Conclusion

Picking a top or bottom without indicator support is a recipe for failure. The pure fade trade is an intraday strategy that picks a top or bottom based on a clear recovery following an extreme move. It isn't foolproof, but if applied correctly, it can be a profitable strategy for forex traders.

Saturday, July 11, 2009

The Currency Market Information Edge

The global foreign exchange (forex) market had an average daily turnover of $3.2 trillion as of April 2007, an increase of 69% from the previous year, according to the 2007 Triennial Central Bank Survey of Foreign Exchange and Derivatives Market Activity, conducted by the Bank for International Settlements. It is by far the largest financial market in the world, and its size and liquidity ensure that new information or news is disseminated within minutes. However, the forex market has some unique characteristics that distinguish it from other markets. These unique features may give some participants an "information edge" in some situations, resulting in new information being absorbed over a longer period.

Unique Characteristics of the Forex Market

Unlike stocks, which trade on a centralized exchange such as the New York Stock Exchange, currency trades are generally settled over the counter (OTC). The OTC nature of the global foreign exchange market means that rather than a single, centralized exchange (as is the case for stocks and commodities), currencies trade in a number of different geographical locations, most of which are linked to each other by state-of-the-art communications technology. OTC trading also means that at any point in time, there are likely to be a number of marginally different price quotations for a particular currency; a stock, on the other hand, only has one price quoted on an exchange at a particular instant.

The global forex market is also the only financial market to be open virtually around the clock, except for weekends. Another key distinguishing feature of the currency markets is the differing levels of price access enjoyed by market participants. This is unlike the stock and commodity markets, where all participants have access to a uniform price.

Market Participants

Currency markets have numerous participants in multiple time zones, ranging from very large banks and financial institutions at one end of the spectrum, to small retail brokers and individuals on the other. Central banks are among the largest and most influential participants in the forex market. However, on a daily basis, large commercial banks are the dominant players in the forex market, on account of their corporate customers and currency trading desks. Large corporations also account for a significant proportion of foreign exchange volume, especially companies that have substantial trade or capital flows. Investment managers and hedge funds are also major participants.

Differing Prices

Banks' currency trading desks trade in the interbank market, which is characterized by large deal size, huge volumes and tight bid/ask spreads. These currency trading desks take foreign exchange positions either to cover commercial demand (for example, if a large customer needs a currency such as the euro to pay for a sizable import), or for speculative purposes. Large commercial customers get prices from these banks that have a markup embedded in them; the markup or margin depends on the size of the customer and the size of the forex transaction. Retail customers who need foreign currency have to contend with bid/ask spreads that are much wider than those in the interbank market.

Speculative Positions Vs. Commercial Transactions

In the global foreign exchange market, speculative positions outnumber commercial foreign exchange transactions, which arise due to trade or capital flows, by a huge margin, although the exact extent is difficult to quantify. This makes the forex market very sensitive to new information, since an unexpected development will cause speculators to reassess their original trades and cause them to adjust these trades to reflect the new information. For example, if a company has to remit a payment to a foreign supplier, it has a finite window in which to do so. The company may try to time the purchase of the currency so as to obtain a favorable rate, or it may use a hedging strategy to cover its exchange risk; however, the transaction has to occur by a definite date, regardless of conditions in the foreign exchange market. On the other hand, a trader with a speculative currency position seeks to maximize his or her trading profit or minimize loss at all times; as such, the trader can choose to retain the position or close it at any point. In the event of new information, the adjustment process for such speculative positions is likely to be almost instantaneous. The proliferation of instant communications technology has caused reaction times to shorten dramatically in all financial markets, not just in the forex market. However, this "knee jerk" reaction is generally followed by a more gradual adjustment process as market participants digest the new information and analyze it in greater depth.

Information Edge

While there are numerous factors that affect exchange rates, from economic and political variables to supply/demand fundamentals and capital market conditions, the hierarchical structure of the forex market gives the biggest players a slight information edge over the smallest ones. In some situations, therefore, exchange rates take a little longer to adjust to new information.

For example, consider a case where the central bank of a major nation with a widely-traded currency decides to support it in the foreign exchange markets, a process known as "intervention." If this intervention is unexpected and covert, the major banks from which the central banks buy the currency have an information edge over other participants, because they know the identity and the intention of the buyer. Other participants, especially those with short positions in the currency, may be taken by surprise to see the currency suddenly strengthen. While they may or may not cover their short positions right away, the fact that the central bank is now intervening to support the currency may cause these participants to reassess the viability and implications of their short strategy.


Example – Forex Market Reaction to News

All financial markets react strongly to unexpected news or developments, and the foreign exchange market is no exception. Consider a situation in which the U.S. economy is weakening, and there is widespread expectation that the Federal Reserve will reduce the benchmark federal funds rate by 25 basis points (0.25%) at its next meeting. Currency exchange rates will factor in this rate reduction in the period leading up to the expected policy announcement. However, if the Federal Reserve decides at its meeting to leave rates unchanged, the U.S. dollar will in all likelihood react dramatically to this unexpected development. If the Federal Reserve implies in its policy announcement that the U.S. economy's prospects are improving, the U.S. dollar may also strengthen against major currencies.


Conclusion

While the massive size and liquidity of the foreign exchange market ensures that new information or news is generally absorbed within minutes, its unique features may result in new information being absorbed over a longer period in some situations. In addition, the hierarchical structure of the forex market can give the biggest players a slight information edge.

Friday, July 10, 2009

What Type Of Forex Trader Are You?

by Richard Lee

What are some things that separate a good trader from a great one? Guts, instincts, intelligence and, most importantly, timing. Just as there are many types of traders, there is an equal number of different time frames that assist traders in developing their ideas and executing their strategies. At the same time, timing also helps market warriors take several things that are outside of a trader's control into account. Some of these items include position leveraging, nuances of different currency pairs, and the effects of scheduled and unscheduled news releases in the market. As a result, timing is always a major consideration when participating in the foreign exchange world, and is a crucial factor that is almost always ignored by novice traders.

Want to bring your trading skills to the next level? Read on to learn more about time frames and how to use them to your advantage.

Common Trader Time frames

In the grander scheme of things, there are plenty of names and designations that traders go by. But when taking time into consideration, traders and strategies tend to fall into three broader and more common categories: day trader, swing trader and position trader.
Click Here

1. The Day Trader

Let's begin with what seems to be the most appealing of the three designations, the day trader. A day trader will, for a lack of a better definition, trade for the day. These are market participants that will usually avoid holding anything after the session close and will trade in a high-volume fashion.

On a typical day, this short-term trader will generally aim for a quick turnover rate on one or more trades, anywhere from 10- to 100-times the normal transaction size. This is in order to capture more profit from a rather small swing. As a result, traders who work in proprietary shops in this fashion will tend to use shorter time-frame charts, using one-, five-, or 15-minute periods. In addition, day traders tend to rely more on technical trading patterns and volatile pairs to make their profits. Although a long-term fundamental bias can be helpful, these professionals are looking for opportunities in the short term.


Figure 1
Source: FX Trek Intellicharts

One such currency pair is the British pound/Japanese yen as shown in Figure 1, above. This pair is considered to be extremely volatile, and is great for short-term traders, as average hourly ranges can be as high as 100 pips. This fact overshadows the 10- to 20-pip ranges in slower moving currency pairs like the euro/U.S. dollar or euro/British pound.

2. Swing Trader

Taking advantage of a longer time frame, the swing trader will sometimes hold positions for a couple of hours - maybe even days or longer - in order to call a turn in the market. Unlike a day trader, the swing trader is looking to profit from an entry into the market, hoping the change in direction will help his or her position. In this respect, timing is more important in a swing trader's strategy compared to a day trader. However, both traders share the same preference for technical over fundamental analysis. A savvy swing trade will likely take place in a more liquid currency pair like the British pound/U.S. dollar. In the example below (Figure 2), notice how a swing trader would be able to capitalize on the double bottom that followed a precipitous drop in the GBP/USD currency pair. The entry would be placed on a test of support, helping the swing trader to capitalize on a shift in directional trend, netting a two-day profit of 1,400 pips.

Figure 2
Source: FX Trek Intellicharts

3. The Position Trader

Usually the longest time frame of the three, the position trader differs mainly in his or her perspective of the market. Instead of monitoring short-term market movements like the day and swing style, these traders tend to look at a longer term plan. Position strategies span days, weeks, months or even years. As a result, traders will look at technical formations but will more than likely adhere strictly to longer term fundamental models and opportunities. These FX portfolio managers will analyze and consider economic models, governmental decisions and interest rates to make trading decisions. The wide array of considerations will place the position trade in any of the major currencies that are considered liquid. This includes many of the G7 currencies as well as the emerging market favorites.

Additional Considerations

With three different categories of traders, there are also several different factors within these categories that contribute to success. Just knowing the time frame isn't enough. Every trader needs to understand some basic considerations that affect traders on an individual level.

Leverage

Widely considered a double-edged sword, leverage is a day trader's best friend. With the relatively small fluctuations that the currency market offers, a trader without leverage is like a fisherman without a fishing pole. In other words, without the proper tools, a professional is left unable to capitalize on a given opportunity. As a result, a day trader will always consider how much leverage or risk he or she is willing to take on before transacting in any trade. Similarly, a swing trader may also think about his or her risk parameters. Although their positions are sometimes meant for longer term fluctuations, in some situations, the swing trader will have to feel some pain before making any gain on a position. In the example below (Figure 3), notice how there are several points in the downtrend where a swing trader could have capitalized on the Australian dollar/U.S. dollar currency pair. Adding the slow stochastic oscillator, a swing strategy would have attempted to enter into the market at points surrounding each golden cross. However, over the span of two to three days, the trader would have had to withstand some losses before the actual market turn could be called correctly. Magnify these losses with leverage and the final profit/loss would be disastrous without proper risk assessment.


Figure 3
Source: FX Trek Intellicharts

Different Currency Pairs

In addition to leverage, currency pair volatility should also be considered. It's one thing to know how much you may potentially lose per trade, but it's just as important to know how fast your trade can lose. As a result, different time frames will call for different currency pairs. Knowing that the British pound/Japanese yen currency cross sometimes fluctuates 100 pips in an hour may be a great challenge for day traders, but it may not make sense for the swing trader who is trying to take advantage of a change in market direction. For this reason alone, swing traders will want to follow more widely recognized G7 major pairs as they tend to be more liquid than emerging market and cross currencies. For example, the euro/U.S. dollar is preferred over the Australian dollar/Japanese yen for this reason.


News Releases

Finally, traders in all three categories must always be aware of both unscheduled and scheduled news releases and how they affect the market. Whether these releases are economic announcements, central bank press conferences or the occasional surprise rate decision, traders in all three categories will have individual adjustments to make.


Short-term traders will tend to be the most affected, as losses can be exacerbated while swing trader directional bias will be corrupted. To this effect, some in the market will prefer the comfort of being a position trader. With a longer term perspective, and hopefully a more comprehensive portfolio, the position trader is somewhat filtered by these occurrences as they have already anticipated the temporary price disruption. As long as price continues to conform to the longer term view, position traders are rather shielded as they look ahead to their benchmark targets. A great example of this can be seen on the first Friday of every month in the U.S. non-farm payrolls report. Although short-term players have to deal with choppy and rather volatile trading following each release, the longer-term position player remains relatively sheltered as long as the longer term bias remains unchanged.


Figure 4
Source: FX Trek Intellicharts

Which Time Frame Is Right?

Which time frame is right really depends on the trader. Do you thrive in volatile currency pairs? Or do you have other commitments and prefer the sheltered, long-term profitability of a position trade? Fortunately, you don't have to be pigeon-holed into one category. Let's take a look at how different time frames can be combined to produce a profitable market position.

Like a Position Trader

As a position trader, the first thing to analyze is the economy - in this case, in the U.K. Let's assume that given global conditions, the U.K.'s economy will continue to show weakness in line with other countries. Manufacturing is on the downtrend with industrial production as consumer sentiment and spending continue to tick lower. Worsening the situation has been the fact that policymakers continue to use benchmark interest rates to boost liquidity and consumption, which causes the currency to sell off because lower interest rates mean cheaper money. Technically, the longer term picture also looks distressing against the U.S. dollar. Figure 5 shows two death crosses in our oscillators, combined with significant resistance that has already been tested and failed to offer a bearish signal.


Figure 5
Source: FX Trek Intellicharts

Like a Day Trader

After we establish the long-term trend, which in this case would be a continued deleveraging, or sell off, of the British pound, we isolate intraday opportunities that give us the ability to sell into this trend through simple technical analysis (support and resistance). A good strategy for this would be to look for great short opportunities at the London open after the price action has ranged from the Asian session.

Although too easy to believe, this process is widely overlooked for more complex strategies. Traders tend to analyze the longer term picture without assessing their risk when entering into the market, thus taking on more losses than they should. Bringing the action to the short-term charts helps us to see not only what is happening, but also to minimize longer and unnecessary drawdowns.

The Bottom Line

Timeframes are extremely important to any trader. Whether you're a day, swing, or even position trader, time frames are always a critical consideration in an individual's strategy and its implementation. Given its considerations and precautions, the knowledge of time in trading and execution can help every novice trader head toward greatness.

Protect Your Foreign Investments From Currency Risk

by Cathy Pareto

Investing in foreign securities, while a good thing for your long-term portfolio, continues to pose new threats for investors. As more people broaden their investment universe by expanding into foreign stocks and bonds, they must also bear the risk associated with fluctuations in exchange rates.

Fluctuations in these currency values, whether the home currency or the foreign currency, can either enhance or reduce the returns associated with foreign investments. Currency plays a significant role in investing; read on to uncover potential strategies that might downplay its effects.

Pros of Foreign Diversification

There is simply no doubting the benefits of owning foreign securities in your portfolio. After all, modern portfolio theory (MPT) has established that the world's markets do not move in lockstep and that by mixing asset classes with low correlation to one another in the appropriate proportions, risk can be reduced at the portfolio level, despite the presence of volatile underlying securities. As a refresher, correlation coefficients range between -1 and +1. Anything less than perfect positive correlation (+1) is considered a good diversifier. The correlation matrix depicted below demonstrates the low correlation of foreign securities against domestic positions.


Monthly Correlations 1988 to 2006
Security Type S&P 500 Index Russell 2000 Index Russell 2000 Value MSCI EAFE International Small Cap International Small Cap Value MSCI Emerging Markets
S&P 500 1 - - - - - -
Russell 2000 0.731 1 - - - - -
Russell 2000 Value 0.694 0.927 1 - - - -
MSCI EAFE 0.618 0.532 0.487 1 - - -
International Small Cap 0.432 0.466 0.414 0.857 1 - -
International Small Cap Value 0.41 0.411 0.414 0.831 0.97 1 -
MSCI Emerging Markets 0.59 0.634 0.586 0.582 0.53 0.512 1
Source: Dimensional Fund Advisors

Combining foreign and domestic assets together tends to have a magical effect on long-term returns and portfolio volatility; however, these benefits also come with some underlying risks.

Risks of International Investments

Several levels of investment risks are inherent in foreign investing: political risk, local tax implications and exchange rate risk. Exchange rate risk is especially important, because the returns associated with a particular foreign stock (or mutual fund with foreign stocks) must then be converted into U.S. dollars before an investor can spend the profits. Let's break each risk down.

* Portfolio Risk

The political climate of foreign countries creates portfolio risks because governments and political systems are constantly in flux. This typically has a very direct impact on economic and business sectors. Political risk is considered a type of unsystematic risk associated with specific countries, which can be diversified away by investing in a broad range of countries, effectively accomplished with broad-based foreign mutual funds or exchange-traded funds (ETFs).

* Taxation

Foreign taxation poses another complication. Just as foreign investors with U.S. securities are subject to U.S. government taxes, foreign investors are also taxed on foreign-based securities. Taxes on foreign investments are typically withheld at the source country before an investor can realize any gains. Profits are then taxed again when the investor repatriates the funds.

* Currency Risk

Finally, there's currency risk. Fluctuations in the value of currencies can directly impact foreign investments, and these fluctuations affect the risks of investing in non-U.S. assets. For example, let's say your foreign investment portfolio generated a 12% rate of return last year, but your home currency lost 10% of its value. In this case, your net return will be reduced when you convert your profits to U.S. dollars. But the reverse is also true; if a foreign stock declines but the value of the home currency strengthens sufficiently, the loss may be averted or otherwise minimized.

Minimizing Currency Risk

Despite the perceived dangers of foreign investing, an investor may reduce the risk of loss from fluctuations in exchange rates by hedging with currency futures. Simply stated, hedging involves taking on one risk to offset another. Futures contracts are advance orders to buy or sell an asset, in this case a currency. An investor expecting to receive cash flows denominated in a foreign currency on some future date can lock in the current exchange rate by entering into an offsetting currency futures position.

In the currency markets, speculators buy and sell foreign exchange futures to take advantage of changes in exchange rates. Investors can take long or short positions in their currency of choice depending on how they believe that currency will perform. For example, if a speculator believes that the euro will rise against the U.S. dollar, he or she will enter into a contract to buy the euro at some predetermined time in the future. This is called having a long position. Conversely, you could argue that the same speculator has taken a short position in the U.S. dollar.

There are two possible outcomes with this hedging strategy. If the speculator is correct and the euro rises against the dollar, then the value of the contract will rise too, and the speculator will earn a profit. However, if the euro declines against the dollar, the value of the contract decreases.

When you buy or sell a futures contract, as in our example above, the price of the good (in this case the currency) is fixed today, but payment is not made until later. Investors trading currency futures are asked to put up margin in the form of cash and the contracts are marked to market each day, so profits and losses on the contracts are calculated each day. Currency hedging can also be accomplished a different way. Rather than locking in a currency price for a later date, you can buy the currency immediately at the spot price instead. In either scenario, you end up buying the same currency, but in one scenario you do not pay for the asset up front.

Investing in the Currency Market

The value of currencies fluctuates with the global supply and demand for a specific currency. Demand for foreign stocks is also a demand for foreign currency, which has a positive effect on its price. Fortunately, there is an entire market dedicated to the trade of foreign currencies called the foreign exchange market (forex for short). This market has no central marketplace like the New York Stock Exchange; instead, all business is conducted electronically in what is considered one of the largest liquid markets in the world.

There are several ways to invest in the currency market, but some are riskier than others. Investors can trade currencies directly by setting up their own accounts or they can access currency investments through forex brokers.

However, margined currency trading is an extremely risky form of investment and is only suitable for individuals and institutions capable of handling the potential losses it entails. In fact, investors looking for exposure to currency investments might be best served acquiring them through funds or ETFs - and there are plenty to choose from. Some of these products make bets against the dollar - some bet in favor, while other funds simply buy a basket of global currencies. For example, you can buy an ETF made up of currency futures contracts on certain G10 currencies, which can be designed to exploit the trend that currencies associated with high interest rates tend to rise in value relative to currencies associated with low interest rates. Things to consider when incorporating currency into your portfolio are costs (both trading and fund fees), taxes (historically, currency investing has been very tax-inefficient) and finding the appropriate allocation percentage.

Conclusion

Investing in foreign stocks has a clear benefit in portfolio construction. However, foreign stocks also have unique risk traits that U.S.-based stocks do not. As investors expand their investments overseas, they may wish to implement some hedging strategies to protect themselves from ongoing fluctuations in currency values. Today, there is no shortage of investment products available to help you easily achieve this goal.

A Forex Trader's View Of The Aussie/Gold Relationship

by Richard Lee

The relationships between different financial markets are almost as old as the markets themselves. For example, in many cases when benchmark equities rise, bonds fall. Many traders will watch for correlations like this and try to capitalize on the opportunity. The same types of relationships exist in the global foreign exchange market. Take for instance the closely related tie between the Australian dollar and gold. Due mostly to the fact that Australia remains a major producer of the yellow metal, the correlation is an opportunity that not only exists, but is one that traders on every level can capitalize on. Let's take a look at why this relationship exists, and how you can use it to produce solid gold returns.

Being Productive Is Key

The U.S. dollar/crude oil relationship exists for one simple reason: the commodity is priced in dollars. However, the same cannot be said about the Aussie correlation. The gold/Australian dollar relationship stems from production. As of 2008, Australia was ranked as the fourth-largest gold producer in the world, coming in behind China, South Africa and the United States. Even though it may not be the largest producer, the "Land Down Under" produces an estimated 225 metric tons of gold per year, according to the consultancy firm GFMS. As a result, it is only natural that the underlying currency of a major commodity producer follows a similar pattern to that commodity. With the ebb and flow of production, the exchange rate will follow supply and demand as money exchanges hands between miner and manufacturer.

According to a 2005 GFMS survey, the last time Australia was ranked second in production behind South Africa, gold production in the South Pacific economy was at a height of approximately 263 tons per year. This volume made up a commanding 10.4% of the market. However, steadily but surely, production has been decreasing year over year (YOY), helping to drive prices higher. Ultimately, the shorter supply of gold has helped to create demand for the Australian dollar, which moved in lockstep with the commodity until mid-2008. If an investor or trader had taken advantage of this simple correlation, he or she would have earned an approximate 30% rate of return on the currency price alone (aside from any rollover interest associated with the trade).

Capitalizing on the Relationship

Although the macro strategy does work on all levels, it is best suited for portfolios that are set in longer time frames. Traders are not going to see strong correlations on every single day of trading, much like other broader market dynamics. As a result, it's advantageous to cushion the blow of daily volatility and risk through a longer time horizon.

Fundamentally oriented traders will tend to trade one or both instruments, taking trading cues from the other. These cues can be gathered from a list of topics including:

1. Commodity Reserve Reports
2. COT Futures Reports
3. Australian Economic Developments
4. Interest Rates
5. Safe Haven Investing

As a result, these trades tend to be longer than day-trade considerations as the portfolio is looking to capture the overall market tone rather than just an intraday pop or drop.

Technically, traders tend to find their cues in technical formations with the hope that corresponding correlations will seep into the related market. Whether the formation is in the gold chart or the Aussie chart, it is better to find one solid formation first, rather than looking for both charts to correlate perfectly. An example of this is clearly seen in the chart examples below.


Figure 1
Source: FX Trek Intellicharts
Figure 2
Source: MetaTrader

As shown in Figure 2, with the market in turmoil and investor deleveraging that was "en vogue" in 2008, traders saw an opportunity to jump on the bandwagon as both Aussie and gold experienced a temporary uptick in price. Already knowing that this would be a blow-off top in an otherwise bearish market, the savvy technical investor could visibly see both assets moving in sync. As a result, technically speaking, a short opportunity shone through as the commodity approached the $905.50 figure, which corresponded with the pivotal 0.8500 figure in the FX market. The double top in gold all but ensured further depression in the Australian dollar/U.S. dollar currency pair.

Trying It Out: a Trade Setup

Now let's take a look at a shorter trade setup involving both the Australian dollar and gold.

First, the broad macro picture. Taking a look at Figure 2, we see that gold has taken a hard dive down as investors and traders have deleveraged and sold off riskier assets. Following this move, subsequent consolidation lends to the belief that a turnaround may be lingering in the market. The idea is supported by the likelihood that equity investors will elect to move some money into the safe haven characteristic of the commodity as global benchmark indexes continue to decline in value.


Figure 3 Source: MetaTrader

We see a similar position developing in the Australian dollar following a spike down to just below the 0.6045 figure, shown in Figure 4 below. At this time, the currency was under extreme pressure as global speculators deemed the Australian dollar a risky currency. Putting these two factors together, portfolio direction is looking to be upward.

Next, we take a look at our charts and apply basic support and resistance techniques. Following our initial trade idea with gold, we first project a textbook channel to our chart as price action has displayed three defining technical points (labeled A, B and C). The gold channel corresponds with a short-term channel developing in the AUD/USD currency pair in Figure 4.


Figure 4
Source: MetaTrader

The combination culminates on December 10, 2008 (Figure 3 Point C). Not only do both assets test the support or lower channel trendline, but we also have a bullish MACD convergence confirming the move higher in the AUD/USD currency pair.

Finally, we place the corresponding entry at the close of the session, 0.6561. The subsequent stop would be placed at the swing low. In this case, that would be the December 5 low of 0.6290, a roughly 271 pip stop. Taking proper risk/reward management into account, we place our target at 0.7103 to give us a 2:1 risk-to-reward ratio. Luckily, the trade takes no longer than a week as the target is triggered on December 18 for a 542 pip profit.

Conclusion

Intermarket strategies like the Australian dollar and gold present ample opportunities for the savvy investor and trader. Whether it's to produce a higher profit/loss ratio or increase overall portfolio returns, market correlations are sure to add value to a market participant's repertoire.

Saturday, June 20, 2009

Introducing The Bearish Diamond Formation

by Richard Lee

For years, market aficionados and forex traders alike have been using simple price patterns not only to forecast profitable trading opportunities but also to explain simple market dynamics. As a result, common formations such as pennants, flags and double bottoms and tops are often used in the currency markets, as well as many other trading markets. A less talked about, but equally useful, pattern that occurs in the currency markets is the bearish diamond top formation, commonly known as the diamond top. In this article, we'll explain how forex traders can quickly identify diamond tops in order to capitalize on various opportunities.

The diamond top occurs mostly at the top of considerable uptrends. It effectively signals impending shortfalls and retracements with relative accuracy and ease. Because of the increased liquidity of the currency market, this formation can be easier to identify in the currency market than in its equity-based counterpart, where gaps in price action frequently occur, displacing some of the requirements needed to recognize the diamond top. This formation can also be applied to any time frame, especially daily and hourly charts, as the wide swings often seen in the currency markets will offer traders plenty of opportunities to trade.

Identifying and Trading the Formation

The diamond top formation is established by first isolating an off-center head-and-shoulders formation and applying trendlines dependent on the subsequent peaks and troughs. It gets its name from the fact that the pattern bears a striking resemblance to a four-sided diamond.

Let's look at a step-by-step breakdown of how to trade the formation, using the Australian dollar/U.S. dollar (AUD/USD) currency pair (Figure 1) as our example. First, we identify an off-center head-and-shoulders formation in a currency pair. Next, we draw resistance trendlines, first from the left shoulder to the head (line A) and then from the head to the right shoulder (line B). This forms the top of the formation; as a result, the price action should not break above the upper trendline resistance formed by the right shoulder. The idea is that the price action consolidates before the impending shortfall, and any penetrations above the trendline would ultimately make the pattern ineffective, as it would mean that a new peak has been created. As a result, the trader would be forced to consider either reapplying the trendline (line B) that runs from the head to the right shoulder, or disregarding the diamond top formation altogether, since the pattern has been broken.

To establish lower trendline support, the technician will simply eye the lowest trough established in the formation. Bottomside support can then be drawn by connecting the bottom tail to the left shoulder (line C) and then connecting another support trendline from the tail to the right shoulder (line D). This connects the bottom half to the top and completes the pattern. Notice how the rightmost angle of the formation also resembles the apex of a symmetrical triangle pattern and is suggestive of a breakout.


Figure 1 - Identifying a diamond top formation using the AUD/USD.

Trading the diamond top isn't much harder than trading other formations. Here, the trader is simply looking for a break of the lower support line, suggesting increasing momentum for a probable shortfall. The theory is quite simple. Both upper resistance and lower support levels established by the right shoulder will contain the price action as each subsequent session's range diminishes, suggestive of a near-term breakout. Once a session closes below the support level, this indicates that selling momentum will continue because sellers have finally pushed the close below this significant mark. The trader will then want to place his/her entry shortly below this level to capture the subsequent decline in the price. This approach works especially well in the currency markets, where price action tends to be more fluid and trends are established more quickly once a certain significant support or resistance level is broken. Money management would be applied to this position through a stop-loss placed slightly above the previously broken support level to minimize any losses that might occur if the break is false and a temporary retracement takes place.

Figure 2 below shows a zoomed in view of Figure 1. We can see that a session candle closed below or "broke" the support trendline (line D.i.), indicating a move lower. The diamond top trader would profit from this by placing an entry order below the close of the support line at 0.7504, while also placing a stop-loss slightly above the same line to minimize any potential losses should the price bounce back above. The standard stop will be placed 50 pips higher at 0.7554. In our example, the stop order would not have been executed because the price did not bounce back, instead falling 150 pips lower in one session before falling even further later on.


Figure 2 - A closer look at the diamond top formation using the AUD/USD. Notice how the position of the entry is just below the support line (D.i.).

Finally, profit targets are calculated by taking the width of the formation from the head of the formation (the highest price) to the bottom of the tail (the lowest price). Staying with our example using the AUD/USD currency pair, Figure 3 shows how this would be done. In Figure 3, the AUD/USD exchange rate at the top of the formation is 0.8003. The bottom of the diamond top is exactly 0.7250. This leaves 753 pips between the two prices that we use to form the maximum price where we can take profits. To be safe, the trader will set two targets in which to take profits. The first target will require taking the full amount, 753 pips, and taking half that amount and subtracting it from our entry price. Then, the first target will be 0.7128. The price target that will maximize our profits will be 0.6751, calculated by subtracting the full 753 pips from the entry price.


Figure 3 - The price target is calculated on the same example of the AUD/USD.

Using a Price Oscillator Helps

One of the cardinal rules of successful trading is to always receive confirmation, and the diamond top pattern is no different. Adding a price oscillator such as moving average convergence divergence and the relative strength index can increase the accuracy of your trade, since tools like these can gauge price action momentum and be used to confirm the break of support or resistance.

Applying the stochastic oscillator to our example (Figure 4 below), the investor confirms the break below support through the downward cross that occurs in the price oscillator (point X).


Figure 4 - The cross of the stochastic momentum indicator (point X) is used to confirm the downward move.

Putting It All Together

Not only do bearish diamond tops form in the major currency pairs like the Euro/U.S. dollar (EUR/USD), the British pound/U.S. dollar (GBP/USD) and the U.S. dollar/Japanese yen (USD/JPY), but they also form in lesser-known cross-currency pairs such as the Euro/Japanese yen (EUR/JPY). Although the formation occurs less in the cross-currency pairs, the swings tend to last longer, creating more profits. Let's look at a step-by-step example of this using the EUR/JPY:


  1. Identify the head and shoulders pattern and confirm the offset nature of the formation by noticing that the head is slightly to the left, while the tail is set to the right.
  2. Form the top resistance by connecting the left shoulder to the tip top of the head (line A) and the head to the right shoulder (line B). Next, draw the trendlines for support by connecting the left shoulder (line C) to the tail and the tail to the right shoulder (line D).
  3. Calculate the width of the formation by taking the prices at the top of the head, 141.59, and the bottom of the tail, 132.94. This will give us a total of 865 pips of distance before we can take our full profits. Divide by two and our first point to take profits will be 432 pips below our entry.
  4. Establish the entry point. Look to the apex of the right shoulder and notice the point where the candle closes below the support line, breaking through. Here, the close of the session is 137.79. The entry order should then be placed 50 pips below at 137.29, while our stop-loss order will be placed 50 pips above at 137.79.
  5. Calculate the first take profit price by subtracting 432 pips from the entry. As a result, the first profit target will be at 133.45.
  6. Finally, confirm the trade by using a price oscillator. Here, the stochastic oscillator signals ahead and confirms the opportunity as it breaks below overbought levels (point X).

If the first target is achieved, the trader will move his/her stop up to the first target, then place a trailing stop to protect any further profits.


Figure 5 - A different example of a diamond top formation using the EUR/JPY cross-currency pair. This chart shows all the trendlines, the highest and the lowest price, and the price target.


Conclusion

Although the bearish diamond top has been overlooked due to its infrequency, it remains very effective in displaying potential opportunities in the forex market. Smoother price action due to the enormous liquidity of the market offers traders a better context in which to apply this method and isolate better opportunities. When this formation is combined with a price oscillator, the trade becomes an even better catch - the price oscillator enhances the overall likelihood of a profitable trade by gauging price momentum and confirming weakness as well as weeding out false breakout/breakdown trades.

Trading The Non-Farm Payroll Report

by Cory Mitchell

The non-farm payroll (NFP) report is a key economic indicator for the United States. It is intended to represent the total number of paid workers in the U.S. minus farm employees, government employees, private household employees and employees of nonprofit organizations.

The NFP report causes one of the consistently largest rate movements of any news announcement in the forex market. As a result, many analysts, traders, funds, investors and speculators anticipate the NFP number - and the directional movement it will cause. With so many different parties watching this report and interpreting it, even when the number comes in line with estimates it can cause large rate swings. Read on to find out how to trade this move without getting knocked out by the irrational volatility it can create.

Trading News Releases

Trading news releases can be very profitable, but it is not for the faint of the heart. This is because speculating on the direction of a given currency pair upon the release can be very dangerous. Fortunately, it is possible to wait for the wild rate swings to subside. Then, traders can attempt to capitalize on the real market move after the speculators have been wiped out or have taken profits or losses. The purpose of this is to attempt to capture rational movement after the announcement, instead of the irrational volatility that pervades the first few minutes after an announcement.

The release of the NFP generally occurs on the first Friday of every month at 8:30am EST. This news release creates a favorable environment for active traders in that it provides a near guarantee of a tradable move following the announcement. As with all aspects of trading, whether we make money on it is not assured. Approaching the trade from a logical standpoint based on how the market is reacting can provide us with more consistent results than simply anticipating the directional movement the event will cause.

The Strategy

The NFP report generally affects all major currency pairs, but one of the favorites among traders is the GBP/USD. Because the forex market is open 24 hours a day, all traders have the capability to trade the news event.

The logic behind the strategy is to wait for the market to digest the information's significance. After the initial swings have occurred, and after market participants have had a bit of time to reflect on what the number means, we will enter a trade in the direction of the dominating momentum. We wait for a signal that indicates the market may have chosen a direction to take rates. This avoids getting in too early and decreases the probability of being whipsawed out of the market before the market has chosen a direction.

The Rules

The strategy can be traded off of five- or 15-minute charts. For the rules and examples, a 15-minute chart will be used, although the same rules apply to a five-minute chart. Signals may appear on different time frames, so stick with one or the other.

1. Nothing is done during the first bar after the NFP report (8:30-8:45am in the case of the 15-minute chart).

2. The bar created at 8:30-8:45 will be wide ranging. We wait for an inside bar to occur after this initial bar (it does not need to be the very next bar). In other words, we are waiting for the most recent bar's range to be completely inside the previous bar's range.

3. This inside bar's high and low rate sets up our potential trade triggers. When a subsequent bar closes above or below the inside bar, we take a trade in the direction of the breakout. We can also enter a trade as soon as the bar moves past the high or low without waiting for the bar to close. Whichever method you choose, stick to it.

4. Place a 30-pip stop on the trade you entered.

5. Make up to a maximum of two trades. If both get stopped out, don't re-enter. The inside bar's high and low are used again for a second trade if needed.

6. Our target is a time target. Generally, most of the move occurs within four hours. Thus, we exit four hours after our entry time. A trailing stop is an alternative if traders wish to stay in the trade.

Example

Figure 1: February 6, 2009. GBP/USD 15-minute chart. Time is GMT.
Source: Forexyard

Looking at Figure 1, the vertical line marks the 8:30am EST (1:30pm GMT) release of the NFP report. As you can see from the chart, there are three bars, or 45 minutes, of back-and-forth action following the release. During this time, we do not trade until we see an inside bar. The inside bar has a square around it on the chart. This bar's price range is fully contained by the previous bar. We will enter when a bar closes higher or lower than the inside bar. The next bar's close is circled, as that is our entry; it closed above the inside bar's high. Our stop is 30 pips below the entry price, which is marked by a solid black horizontal bar.

Because our entry occurred at approximately at 9:45am EST (2:45pm GMT), we will close out our position four hours later. By entering the trade at 1.4670 and exiting four hours later at 1.4820, 150 pips were captured while risking only 30 pips. However, it should be noted that not every trade will be this profitable.

Strategy Downfall

While this strategy can be very profitable, it does have some pitfalls to be aware of. For one, the market may move in one direction aggressively and thus may be beginning to fade by the time we get an inside bar signal. In other words, if a strong move occurs prior to the inside bar, it is possible a move could exhaust itself before we get a signal. It is also important to note that in high volatility times, even after waiting for a pattern setup, rates can reverse quickly. This is why it very important to have a stop in place.


Summary

The logic behind this strategy of trading the NFP report is based on waiting for a small consolidation, the inside bar, after the initial volatility of the report has subsided and the market is choosing which direction it will go. By controlling risk with a moderate stop we are poised to make a potentially large profit from a huge move that almost always occurs each time the NFP is released.

The Myth Of Profit/Loss Ratios

When trading the forex market or other markets, we are often told of a common money management strategy that requires that the average profit be more than the average loss per trade. It's easy to assume that something that has been so widely advised must be a good thing. However, if we take a deeper look at the relationship between profit and loss, it is clear that the "old," commonly-held ideas may need to be adjusted.

Profit/Loss Ratio

A profit/loss ratio refers to the size of the average profit compared to the size of the average loss per trade. For example, if your expected profit is $900 and your expected loss is $300 for a particular trade, your profit/loss ratio is 3:1 - which is $900 divided by $300.

Many trading books and "gurus" advocate a profit/loss ratio of at least 2:1 or 3:1, which means that for every $200 or $300 you make per trade, your potential loss should be capped at $100.

At first glance, most people would agree with this recommendation. After all, shouldn't any potential loss be kept as small as possible and any potential profit be as much as possible? The answer is: not always. In fact, this common piece of advice can be misleading, and can cause harm to your trading account.

The blanket advice of having a profit/loss ratio of at least 2:1 or 3:1 per trade is over-simplistic because it does not take into account the practical realities of the forex market (or any other markets), the individual's trading style and the individual's average profitability per trade (APPT) factor, which is also referred to as statistical expectancy.

APPT is Key to Profitability

Average profitability per trade basically refers to the average amount you can expect to win or lose per trade. Most people are so focused on either balancing their profit/loss ratios or on the accuracy of their trading approach that they are unaware that a bigger picture exists: Your trading performance depends largely on your APPT.

This is the formula for average profitability per trade:


Average Profitability Per Trade = (Probability of Win x Average Win) - (Probability of Loss x Average Loss)

Let's explore the APPT of the following hypothetical scenarios:

Scenario A:

Let's say that out of 10 trades you place, you profit on three of them and you realize a loss on seven. Your probability of a win is thus 30% or 0.3, while your probability of loss is 70% or 0.7. Your average winning trade makes $600 and your average loss is $300.

In this scenario, the APPT is:

(0.3 x $600) – (0.7 x $300) = - $30
As you can see, the APPT is a negative number, meaning that for every trade you place, you are likely to lose $30. That's a losing proposition!

Even though the profit/loss ratio is 2:1, this trading approach produces winning trades only 30% of the time, which negates the supposed benefit of having a 2:1 profit/loss ratio.

Scenario B:

Now let's explore the APPT of a trading approach that has a profit/loss ratio of 1:3, but has more winning trades than losing ones. Let's say out of the 10 trades you place, you make profit on eight of them, and you realize a loss on two trades.

Here is the APPT:

(0.8 x $100) – (0.2 x $300) = $20
In this case, even though this trading approach has a profit/loss ratio of 1:3, the APPT is positive, which means you can be profitable over time.

Many Ways of Becoming Profitable

When trading the forex market, there is no one-size-fits-all money management or trading approach. Traditional advice, such as making sure your profit is more than your loss per absolute trade, does not have much substantial value in the real trading world unless you have a high probability of realizing a winning trade. What matters is that your APPT comes up positive and that your overall profits are more than your overall losses.

Thursday, June 18, 2009

Forex: Wading Into The Currency Market

by Kathy Lien

Whenever you devote money to trading, it is important to take it seriously. For traders who are getting into the forex (FX) market for the first time, it basically means starting from square one. But new traders don't have to be left in the dark when it comes to learning to trade currencies; unlike with some of the other markets, there is a variety of free learning tools and resources available to light the way. You can become FX-savvy with the help of virtual demo accounts, mentoring services, online courses, print and online resources, signal services and charts. With so much to choose from, the question you're most likely to ask is, "Where do I start?" Here we cover the preliminary steps you need to take to find your footing in the FX market.

Finding a Broker

The first step is to pick a market maker with which to trade. Some are larger than others, some have tighter spreads and others offer additional bells and whistles. Each market maker has its own advantages and disadvantages, but here are some of the key questions to ask when doing your due diligence:

* Where is the FX market maker incorporated? Is it in a country such as the U.S. or the U.K., or is it offshore?
* Is the FX market maker regulated? If so, in how many countries?
* How large is the market maker? How much excess capital does it have? How many employees?
* Does the market maker have 24-hour telephone support?

In order to ensure that the money you are sending will be safe and that you have a jurisdiction to appeal to in the event of a bankruptcy, you want to find a large market maker that is regulated in at least one or two major countries. Furthermore, the larger the market maker, the more resources it can put toward making sure that its trading platforms and servers remain stable and do not crash when the market becomes very active. Third, you want a market maker with a larger number of employees so that you can place a trade over the phone without having to worry about getting a busy signal. Bottom line, you want to find someone legitimate to trade with and avoid a bucket shop.

Checking Their Stats

In the U.S., all registered futures commission merchants (FCMs) are required to meet strict financial standards, including capital adequacy requirements, and are required to submit monthly financial reports to regulators. You can visit the website of the Commodity Futures Trading Commission (an independent agency of the U.S. government) to access the latest financial statements of all registered FCMs in the U.S.

Another advantage of dealing with a registered FCM is greater transparency of business practices. The National Futures Association keeps records of all formal proceedings against FCMs, and traders can find out if the firm has had any serious problems with clients or regulators by checking the NFA's Background Affiliation Status Information Center (BASIC) online.

Test Drive

Once you've found a broker, the next step is to test drive its software by opening a demo account. The availability of demo or virtual trading accounts is something unique to this market and one that you'll want to exploit to your advantage. Your goal is to learn how to use the trading platform and, while you're doing that, to find the trading platform that suits you best. Most demo accounts have exactly the same functionalities as live accounts, with real-time market prices. The only difference, of course, is that you are not trading with real money.

Demo trading allows you not only to make sure that you fully understand how to use the trading platform, but also to practice some trading strategies and to make money in the paper account before you move on to a live account funded with real money. In other words, it gives you a chance to get a feel for the FX market.

Do Your Research

When you trade, you never want to trade impulsively. You need to be able to justify your trades, and the way to find justification is by doing your research. There are many books, newspapers and other publications with information about trading the FX market. When choosing a source to consult, make sure it covers:

* The basics of the FX market
* Technical analysis
* Key fundamental news and events

Because the FX market is primarily a technically driven market, the best book that you can read as a new trader is one on technical analysis. The better you get at technical analysis, the better you can trade the FX market from a speculative perspective.

When it comes to newspapers, seasoned foreign exchange traders typically refer to the Financial Times and the Wall Street Journal simply because they contain international news. Trading FX involves looking beyond mere economics, since politics and geopolitical risks can also affect a currency's trading behavior. Therefore, it's also important to keep up with major non-financial news sources such as the International Herald Tribune and the BBC (online, on TV or on the radio) for the big stories of the day.

One of the most popular magazines among FX traders is the Economist, because it covers many macro themes; however, currency-specific and trading magazines are also popular.

Once you have a solid foundation in FX trading, you need to keep up to date on daily fundamental and technical developments in the FX market. A variety of free FX-specific research websites, which can be found easily on the internet, will do the trick.

Education and Mentoring Programs - Are They Worth It?

The benefit of online or live courses over books, newspapers and magazines is that you can get answers to the questions that perplex you. Hearing or seeing other people's questions is also extremely valuable, since no one person can think of every possible question. In a classroom setting, either online or live, you can learn from the experiences and frustrations of others. As for a mentor, he or she can draw on personal experience and hopefully teach you to avoid the mistakes he or she has made in the past, saving you both time and money.

What About Trading Systems and Signals?

Many traders wonder whether it is worthwhile to buy into a system or a signal package. Systems and signals fall into three general categories depending on their methodology: trend, range or fundamental. Fundamental systems are very rare in the FX market; they are mostly used by large hedge funds or banks because they are very long term in nature and do not give many trading signals. The systems that are available to individual traders are typically trend systems or range systems - rarely will you get one system that is able to exploit both markets, because if you do, then you have pretty much found the holy grail of trading.

Even the largest hedge funds in the world are still looking for the switch that can identify whether they are in a trend or a range-bound market. Most large hedge funds tend to be trend following, which is why hedge funds as a group did so poorly in 2004, when the market was trapped in a tight trading range. Range-bound systems will only perform well in range-bound markets, while trend systems will make money in trending markets and lose money in range-bound markets. So, when you buy into a system or a signal provider, you should try to find out whether the signals are mostly range-bound signals or trend signals. This way you can know when to take the signals and when to avoid them.

Trading Setups - Finding What Works Best for You

Every trader is different, but the best trading style is probably a combination of both technical and fundamental analysis. Fundamentals can easily throw off technicals, while technicals can explain movements that fundamentals cannot. Smart traders will always be aware of the broader fundamental picture while using their technicals to pinpoint good entry and exit levels; combining both will keep you out of as many bad trades as possible, and it works for both day traders and swing traders. Most free charting packages have everything that a new trader needs, and many trading platforms offer real-time news feeds to keep you up to date on economic news.

Conclusion

Learning to trade in the FX market can seem like a daunting task when you're just starting out, but thanks to the many practical and educational resources available to the individual trader, it is not impossible. Learning as much as possible before you put actual money at risk should be at the forefront of your agenda. Print and online publications, trading magazines, personal mentors, online demo accounts and more can all act as invaluable guides on your journey into currency trading.